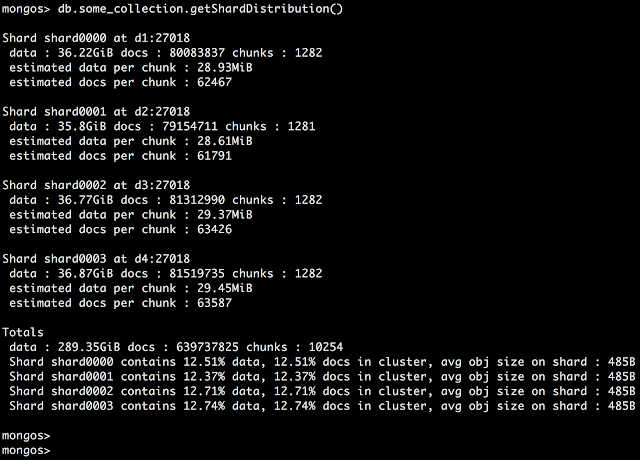
One of the most important things in the MongoDB shard environment is to keep your data balanced among the shards. The data might not be evenly distributed or not distributed at all for a number of reasons. A quick way to check your data distribution on a specific collection is to use getShardDistribution() command. This commands provides you with a snapshot of the current state of each shard for a specific collection including the size of each shard and distribution percentage. Shards could be unbalanced because of improper configuration, wrong shard key or because the balancer is not working properly or fast enough. When a new shard is added, it could take days to re-balance all the shards depending on the data size.
Not Balanced Example
Balanced Example
Not Balanced Example
// MongoDB Shard Distribution
db.collection_name.getShardDistribution()


Shard shard0000 at d1:27018
 data : 80.85Gb docs : 93577613 chunks : 3106
 estimated data per chunk : 26.65Mb
 estimated docs per chunk : 30128

Shard shard0001 at d2:27018
 data : 79.72Gb docs : 92264345 chunks : 3106
 estimated data per chunk : 26.28Mb
 estimated docs per chunk : 29705

Shard shard0002 at d3:27018
 data : 73.64Gb docs : 85235367 chunks : 3106
 estimated data per chunk : 24.28Mb
 estimated docs per chunk : 27442

Shard shard0003 at d4:27018
 data : 70.99Gb docs : 82165553 chunks : 3107
 estimated data per chunk : 23.39Mb
 estimated docs per chunk : 26445

Shard shard0004 at d1:27020
 data : 8.36Gb docs : 9680754 chunks : 358
 estimated data per chunk : 23.92Mb
 estimated docs per chunk : 27041

Shard shard0005 at d2:27020
 data : 8.86Gb docs : 10265908 chunks : 358
 estimated data per chunk : 25.37Mb
 estimated docs per chunk : 28675

Shard shard0006 at d3:27020
 data : 7.91Gb docs : 9166138 chunks : 358
 estimated data per chunk : 22.65Mb
 estimated docs per chunk : 25603

Shard shard0007 at d4:27020
 data : 7.97Gb docs : 9234235 chunks : 357
 estimated data per chunk : 22.88Mb
 estimated docs per chunk : 25866

Totals
 data : 338.35Gb docs : 391589913 chunks : 13856
 Shard shard0000 contains 23.89% data, 23.89% docs in cluster, avg obj size on shard : 927b
 Shard shard0001 contains 23.56% data, 23.56% docs in cluster, avg obj size on shard : 927b
 Shard shard0002 contains 21.76% data, 21.76% docs in cluster, avg obj size on shard : 927b
 Shard shard0003 contains 20.98% data, 20.98% docs in cluster, avg obj size on shard : 927b
 Shard shard0004 contains 2.47% data, 2.47% docs in cluster, avg obj size on shard : 927b
 Shard shard0005 contains 2.62% data, 2.62% docs in cluster, avg obj size on shard : 927b
 Shard shard0006 contains 2.34% data, 2.34% docs in cluster, avg obj size on shard : 927b
 Shard shard0007 contains 2.35% data, 2.35% docs in cluster, avg obj size on shard : 927b
Balanced Example
// MongoDB Shard Distribution
db.collection_name.getShardDistribution()

Shard shard0000 at d1:27018
 data : 36.22GiB docs : 80083837 chunks : 1282
 estimated data per chunk : 28.93MiB
 estimated docs per chunk : 62467

Shard shard0001 at d2:27018
 data : 35.8GiB docs : 79154711 chunks : 1281
 estimated data per chunk : 28.61MiB
 estimated docs per chunk : 61791

Shard shard0002 at d3:27018
 data : 36.77GiB docs : 81312990 chunks : 1282
 estimated data per chunk : 29.37MiB
 estimated docs per chunk : 63426

Shard shard0003 at r2d4:27018
 data : 36.87GiB docs : 81519735 chunks : 1282
 estimated data per chunk : 29.45MiB
 estimated docs per chunk : 63587

Shard shard0004 at d1:27020
 data : 36.26GiB docs : 80174212 chunks : 1280
 estimated data per chunk : 29MiB
 estimated docs per chunk : 62636

Shard shard0005 at d2:27020
 data : 36.34GiB docs : 80358156 chunks : 1282
 estimated data per chunk : 29.03MiB
 estimated docs per chunk : 62681

Shard shard0006 at d3:27020
 data : 35.78GiB docs : 79113388 chunks : 1282
 estimated data per chunk : 28.58MiB
 estimated docs per chunk : 61710

Shard shard0007 at d4:27020
 data : 35.28GiB docs : 78020796 chunks : 1283
 estimated data per chunk : 28.16MiB
 estimated docs per chunk : 60811

Totals
 data : 289.35GiB docs : 639737825 chunks : 10254
 Shard shard0000 contains 12.51% data, 12.51% docs in cluster, avg obj size on shard : 485B
 Shard shard0001 contains 12.37% data, 12.37% docs in cluster, avg obj size on shard : 485B
 Shard shard0002 contains 12.71% data, 12.71% docs in cluster, avg obj size on shard : 485B
 Shard shard0003 contains 12.74% data, 12.74% docs in cluster, avg obj size on shard : 485B
 Shard shard0004 contains 12.53% data, 12.53% docs in cluster, avg obj size on shard : 485B
 Shard shard0005 contains 12.56% data, 12.56% docs in cluster, avg obj size on shard : 485B
 Shard shard0006 contains 12.36% data, 12.36% docs in cluster, avg obj size on shard : 485B
 Shard shard0007 contains 12.19% data, 12.19% docs in cluster, avg obj size on shard : 485B


